|
|
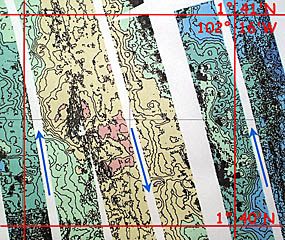
The DSL-120 bathymetry map of the same area as in the previous slide produced by the sonar processing team -- Steve Gegg, Paul Johnson, Julia Getsiv and Greg Kurras. All three north-south lines we have run are shown. The blue arrows show the track and direction of the sonar fish. The depth contours on this map are shown every 10 meters; however, the data will later be plotted at 4 meter intervals. The DSL-120 sonar “sees” much smaller features (more than 10 times smaller!) than the multibeam bathymetry system. The pinkish area is shallow (i.e. elevated seafloor). Every color change equals 50 meters, and the pink to yellow color change is the 2850 m contour. Note all the small circular, or “closed” contours just to the left of the 102° 16’W longitude line. On the next slide, you will see that these features are small volcanic cones that cast little shadows away from the nadir (trackline) for the easternmost DSL-120 survey line.
|
© 2010 Dive and Discover™. Dive and Discover™ is a registered trademark of
Woods
Hole Oceanographic Institution