|
|
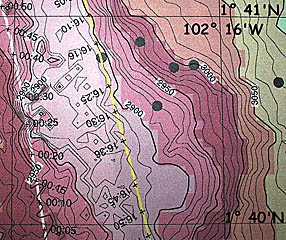
A multibeam bathymetric map produced by Uta Peckman showing the depth contours (lines of equal depth) every 10 meters, in the area bounded by 1° 40’N to 1° 41’N latitude and 102° 16’W and 102° 17’W longitude. Dan Scheirer, Scott White and Uta helped produce the navigation data for two of the three DSL-120 sonar survey lines which are shown with time marks. These maps are what we use to make preliminary interpretations of the sonar data. The black dots are the positions of some of the seismic events detected by the Autonomous Hydrophone Array. The next two slides show the DSL-120 bathymetry and the acoustic (or backscatter) image respectively of the same area of seafloor.
|
© 2010 Dive and Discover™. Dive and Discover™ is a registered trademark of
Woods
Hole Oceanographic Institution