|
|
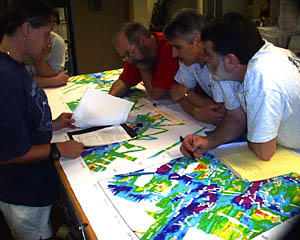
Using rainbow-colored bathymetric charts, researchers Bob Collier, Dan Fornari, Marvin Lilley and Susan Humphris plan explorations to different research areas. The bathymetric charts measure water depth -- the distance from the sea surface to the bottom of the ocean. Reds, oranges and yellows indicate shallow areas, while greens, blues and purples mark deeper spots.
|
Mailing List | Feedback | Glossary | For Teachers | About Us | Contact
© 2010 Dive and Discover™. Dive and Discover™ is a registered trademark of
Woods
Hole Oceanographic Institution