What Does a Young Galápagos Submarine Lava Flow Look Like?
Mapping lava flows with the MR1 side-scan sonar system is one thing but actually seeing them is even better!
Jenny Engels has been busy measuring the lengths and areas of the 33 lava flows we have mapped on the flanks of Fernandina and Isabela. She has determined that these flows are large they average 14 km in length and have areas of about 630 square kilometers.
Now it is time to see what one looks like! We selected a lava flow northwest of Fernandina volcano for our camera tow survey. We chose it because its strong (dark) reflectance on the MR1 side-scan sonar image suggested it might be very young. The lava flow is in 3100-3200 m of water, and is 19 km long -- very long for an underwater lava flow!
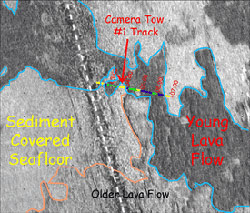
We towed the camera across a narrow part of the lava flow so that we would see different parts of the seafloor covered with both lava and sediment. The side-scan image shows the young, dark lava flow outlined in blue. It has flowed over an older, sediment-covered lava flow outlined in orange.
The colored areas along the camera track (above) show the different types of lava or sediment-covered seafloor we observed. Yellow indicates sediment-covered areas, blue is pillow lava flows, and green is sheet lava flows. We were surprised to find that the lava flow has sediment on it along most of the survey track.The few centimeters of sediment dusting the tops of the flow indicate that it may be hundreds to perhaps one thousand years old but that's young in geological terms.
Follow along the camera tow track as you look at photos of the seafloor in the slide show. The slides are in chronological order, starting from the left end of the camera track. Each photograph is approximately 4 meters by 6 meters in size.
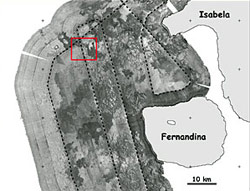
MR1 sonar backscatter map for the area north and west of Fernandina. Darker areas of strong acoustic reflections from young lava flows and steep slopes facing the sonar fish. The red box shows the area blown up in the figure below.